 Owlie
Function Plotter
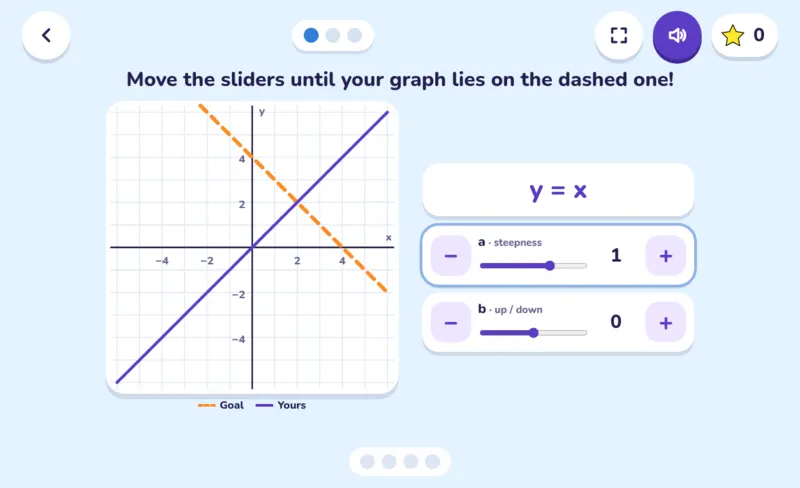
Graphs you can move: sliders change the numbers in a formula, and the line or parabola moves with them. The goal is to make your graph lie exactly on the dashed one.
- 13–16 years
- Read aloud
- No ads
- EN · БГ · РУ · УК
What your child learns
- What the slope and intercept of a line do
- How a parabola shifts and stretches
- Reading a formula from a graph
How to play
Move the sliders for a and b (later h and k) and watch the graph change until it matches. On level 3, pick which formula draws the dashed graph; a wrong one is drawn so you can see why.
Levels
- Level 1Lines y = ax + b.
- Level 2Parabolas y = a(x − h)² + k.
- Level 3Which formula draws this graph?
A tip for parents
Ask your teen to show you what happens to the line when a is negative.
Works on phones, tablets and computers, with nothing to install. No ads and no tracking.
 Circuit Lab
 Molecule Builder
 Orbit Sandbox
 Real-Data Charts